
Australia’s solar generation is growing—and storage is changing its role
Solar supplied almost one-fifth of Australia’s electricity in 2025. Explore how rooftop panels, large solar farms and battery storage are reshaping the country’s energy system.
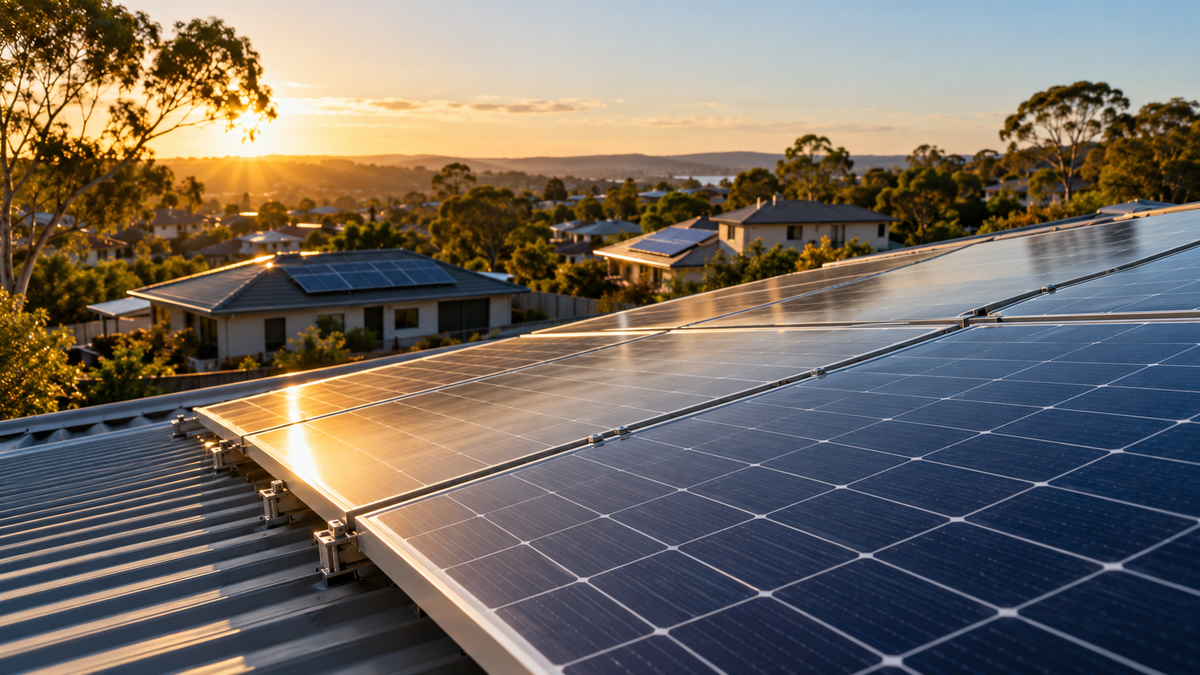
Australia’s solar sector has reached a substantial milestone: it supplied almost one-fifth of the country’s electricity in 2025. Its growing contribution is also changing the questions facing electricity planners, businesses and households. Alongside installing more panels, Australia must make effective use of their output throughout the day. [1]
Official national estimates put solar’s share of electricity generation at 19.6% in 2025. Rooftop systems contributed more than large solar farms, showing how widely distributed generation has become part of Australia’s electricity supply. These statistics include electricity generated outside the major grids and power produced for businesses’ own use. [1]
Rooftop installations remain a major driver
The Clean Energy Council reports that Australians installed 1.89 GW of rooftop solar across more than 180,000 installations in the first half of 2026. It also reports 276,011 home battery installations during that period. These industry figures describe new equipment installed; they do not measure the electricity that equipment subsequently produced. [2]
The preceding year illustrates why installation trends need careful interpretation. The Clean Energy Regulator estimated that small-scale solar additions fell to 2.8 GW in 2025, from 3.2 GW in 2024. Average system size nevertheless increased from 9.9 kW to 10.3 kW. [3]
The regulator attributed some of the slowdown to installers moving into battery retrofits. That explanation draws on market intelligence, rather than a controlled causal study. Its recent installation estimates are also subject to revision because certificates can be created after installation. [3]
Generation and timing matter together
AEMO’s latest quarterly evidence shows continued growth in actual output. In the National Electricity Market during July–September 2026, distributed PV output increased 13% from the corresponding quarter a year earlier, while grid-scale solar increased 30%. [4]
Batteries are helping move electricity between hours. AEMO reports average grid-scale battery charging of 13.4 GWh during daylight hours and discharge of 10.9 GWh during the evening peak per day in that quarter. Charging and discharge differ partly because storage involves losses and the reported time windows differ. [4]
These observations support a practical interpretation: solar’s usefulness increasingly depends on the equipment, networks and demand patterns around it. An annual generation total cannot show whether supply is available at a particular evening peak.
The project pipeline needs careful reading
Large-scale investment is also progressing. The Clean Energy Council reports that 12 generation projects totalling 2.6 GW reached financial close in the first half of 2026; solar and solar hybrids accounted for 11 projects. [5]
Financial close is a development milestone. It does not mean all that capacity is already generating. The same report separately identifies projects entering operation, allowing readers to distinguish investment commitments from delivered electricity. [5]
Assess the whole electricity system
CSIRO’s July 2026 summary of GenCost concludes that renewables supported by storage remain the lowest-cost investment pathway for achieving a net-zero electricity system. This is modelling of future investment choices, with outcomes dependent on assumptions; it is not a guarantee of an individual household’s bill. [6]
CSIRO also distinguishes generation costs from the network, retail and other costs included in electricity bills. That distinction matters when interpreting claims about cheap solar electricity. [7]
The evidence points towards a broader measure of progress: electricity delivered when people need it, alongside new capacity installed. Tracking generation, storage, network readiness and project completion together gives a more useful picture of Australia’s solar transition.
Sources
Numbered references correspond to the sources below.